Introduction
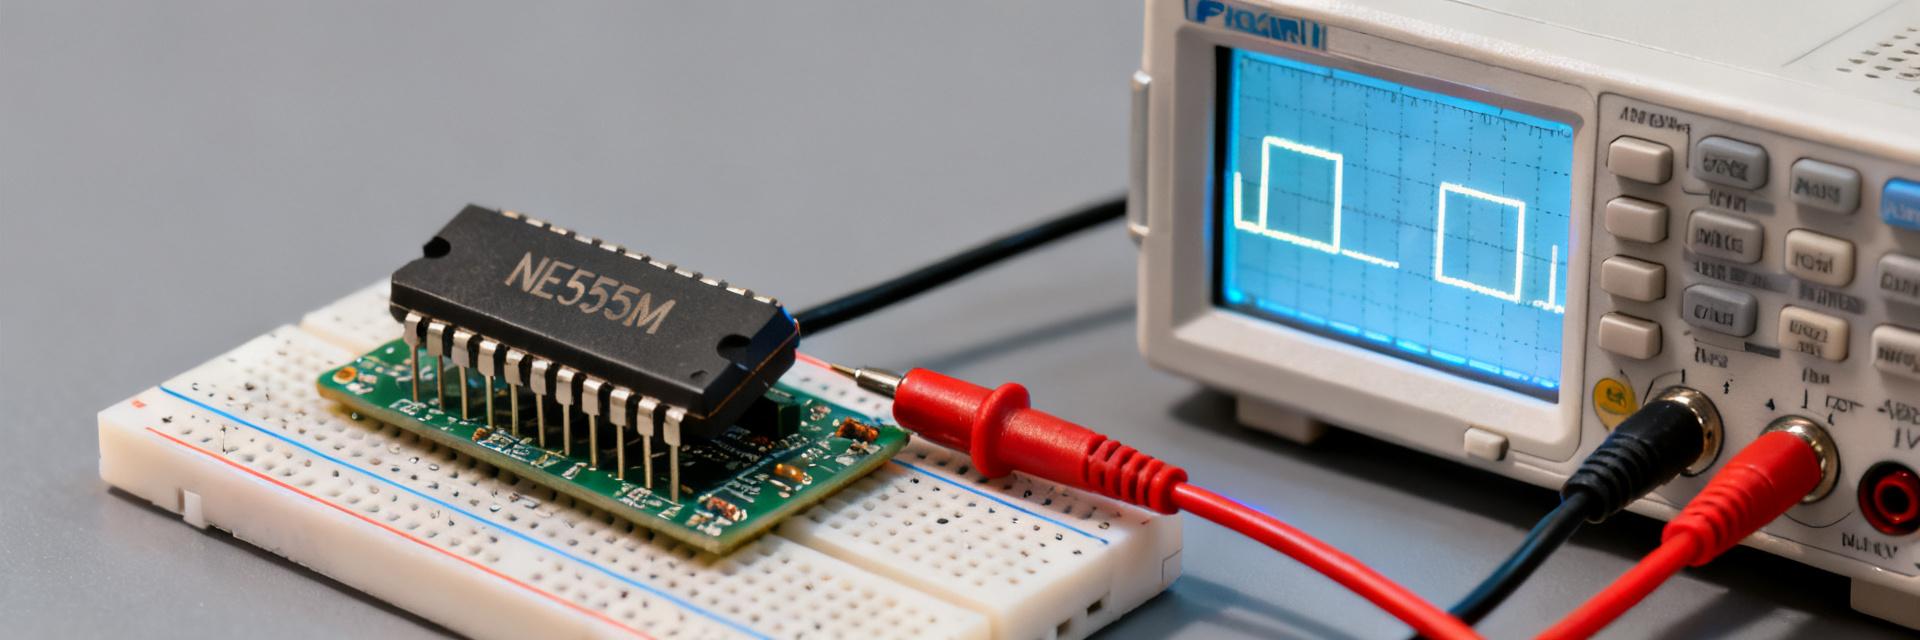
Engineers often observe measurable variance between published specs and bench results for timing ICs: timing stability can shift by several percent, supply sensitivity can introduce microamp-level quiescent shifts, and output drive saturations alter duty-cycle under load. This piece gives a metric-focused guide to interpreting the NE555M datasheet and validating critical performance in the lab so hardware designers, test engineers, and experienced hobbyists can translate numbers into acceptance criteria.
The goal is practical: identify which datasheet entries matter most, how they map to real-world error sources, and step-by-step tests to confirm timing accuracy, output behavior, and thermal margins. Readers will get concrete test setups, common pitfalls, and a compact checklist for meeting datasheet-stated performance.
Background — NE555M overview: package, common uses, and datasheet layout
NE555M variants and where this part fits in design choices
Point: The NE555M is a general-purpose timing IC in compact packages suitable for astable and monostable tasks. Evidence: Functional characteristics—internal comparators, flip-flop, discharge transistor—make it a versatile analog timer. Explanation: Designers choose the NE555M for simplicity and robustness where millisecond-to-second timing and moderate drive (tens of milliamps) are acceptable; for sub-microsecond or precision timebases, dedicated oscillators outperform general-purpose timers.
How the datasheet is organized: key sections to read first
Point: Quick-read order speeds evaluation. Evidence: Start with absolute maximum ratings, followed by recommended operating conditions, electrical characteristics, typical performance curves, and thermal/mechanical data. Explanation: This sequence reveals immediate red lines (max ratings), operating envelopes, expected parameter ranges, and any thermal derating—letting engineers assess whether the part fits the intended application before deeper analysis.
Data analysis — Core electrical metrics and what they mean for performance
Timing-related specs: thresholds, control pin behavior, and capacitor/ resistor tolerances
Point: Thresholds and leakage set timing error floors. Evidence: Datasheet threshold/trigger voltages and typical control-pin transfer behavior, combined with timing-capacitor leakage and resistor tolerance, determine period tolerance. Explanation: For an RC time constant, a 1% cap tolerance plus internal comparator threshold spread often yields >1.5% timing variance; add capacitor leakage and resistor drift for worst-case estimates. Use tighter tolerances or calibration for sub-percent goals.
Output and supply specs: VCC range, quiescent current, output drive, and timing under load
Point: Supply and output limits change duty-cycle fidelity. Evidence: VCC min/max, quiescent current vs. supply, and output sourcing/sinking specs show how drive capability varies with voltage. Explanation: Under heavy load the output saturates—raising VO(sat) reduces effective voltage across timing network and shifts pulse width. Design margins: keep load currents within specified source/sink figures and decouple the supply to stabilize timing under transient loads.
Data analysis — Environmental & dynamic constraints: temperature, frequency limits, and jitter
Temperature effects and derating: reading thermal specs and curves
Point: Temperature causes predictable parameter shifts. Evidence: Junction-to-ambient thermal resistance and operating temperature range indicate when derating is required. Explanation: Expect comparator thresholds and quiescent current to drift with temperature; apply standard derating (e.g., reduce allowable average power or increase timing margin) so timing error stays within target across specified ambient ranges.
Dynamic performance: switching speed, propagation delays, and jitter implications
Point: Switching transients and delays set jitter and maximum usable frequency. Evidence: Propagation delays, output rise/fall times, and any noted timing spread indicate dynamic limits. Explanation: Supply ripple, control-pin noise, and parasitic capacitance add jitter. For frequencies above a few hundred kilohertz, measure edge symmetry and jitter margin; if jitter exceeds spec, add filtering or choose a faster timing architecture.
Method guide — How to validate NE555M datasheet metrics: test setups and measurement tips
Recommended bench setups for timing, supply, and output tests
Point: Controlled instrumentation yields repeatable verification. Evidence: Use a low-noise DC supply, high-bandwidth scope, calibrated probes, and stable reference components. Explanation: Suggested setup: scope with ≥100 MHz bandwidth, 10x probes with known capacitance, supply with <1 mV ripple and current limiting, and precision resistors/caps (1% or better). Decouple VCC at the IC pins with a 0.1 µF ceramic placed within a few millimeters.
Interpreting oscilloscope traces, common measurement pitfalls, and repeatability
Point: Measurement error often mimics device error. Evidence: Probe capacitance, ground lead inductance, and missing decoupling cause pulse distortion. Explanation: Look for consistent rise/fall times, minimal overshoot, and stable baseline across captures. Use averaging for low-frequency jitter estimates, calibrate probe compensation, and avoid long ground loops. Document ambient temperature and component IDs for repeatability.
Actionable guidance — Practical design checklist, tuning tips, and application expectations
Design checklist to meet datasheet performance in real circuits
Point: A short checklist prevents common failures. Evidence: Items tied to datasheet metrics—component tolerances, decoupling, layout, thermal margin, and load isolation—address typical discrepancies. Explanation: Targets: use ≤2% resistors, C0G or film caps when possible, 0.1 µF decoupling at supply pins, keep traces short, isolate heavy loads with a driver transistor, and allow ≥10°C margin to guaranteed operating temp for reliability.
Typical application notes: expected behavior in astable and monostable circuits
Point: Expect measurable drift under load and temperature. Evidence: Datasheet-derived frequency accuracy ranges and duty-cycle variation under specified load conditions. Explanation: For astable setups, frequency accuracy commonly sits within a few percent with standard components; duty-cycle shifts appear when output sinks significant current. Verify pulse-width repeatability by measuring many cycles and checking median and standard deviation against acceptance criteria.
| Datasheet parameter | Real-world impact | Recommended test |
|---|---|---|
| Threshold/Trigger Voltage | Sets timing window; tolerance → timing error | Measure comparator points with slow triangular V across timing cap |
| Output Source/Sink Current | Determines VO(sat) and duty shift under load | Load output incrementally and record VO and timing shift |
| Quiescent Current / Thermal Resistance | Impacts power/thermal derating and long-term stability | Measure IQ at min/max VCC and at elevated ambient temps |
Summary
- Read thresholds and recommended operating conditions first; these datasheet entries govern timing accuracy and set the baseline for lab validation using known RC tolerances and comparator behavior.
- Verify output drive and VCC behavior under realistic loads; IO saturation changes duty cycle and should be tested with incremental loading to match expected application currents.
- Account for temperature and thermal resistance in margin calculations; derate or increase timing margins to maintain stable performance across the specified range.
- Use controlled bench setups with proper decoupling and calibrated components to reproduce advertised performance and document deviations against the datasheet.
FAQ
How precise is NE555M timing accuracy from the datasheet?
The datasheet gives comparator thresholds and typical spreads, but overall timing accuracy depends on external component tolerances and leakage. Expect a few percent variation with standard passive parts; achieving sub-1% requires precision resistors, low-leakage capacitors, and calibration. Bench-verify by comparing measured period to calculated RC values across temperature and supply ranges.
How to test NE555M frequency stability under load?
Use a low-noise supply, instrument-grade scope, and repeatable loading steps. Record frequency and duty cycle while incrementally increasing output load; run tests at nominal and edge VCC values and at elevated ambient temperature. Acceptance criteria tie back to datasheet source/sink specs and recommended operating conditions.
What are common causes of jitter and how to mitigate them for high-performance use?
Supply ripple, control-pin noise, probe capacitance, and parasitics produce jitter. Mitigate with local decoupling, control-pin filtering, short PCB traces, and using higher-quality timing capacitors. For critical low-jitter applications consider a dedicated oscillator or phase-locked solution if margin remains inadequate.
How does operating temperature affect the NE555M threshold stability?
Operating temperature causes predictable parameter drift in internal comparator thresholds and quiescent current. Apply appropriate thermal derating, minimize internal junction heating, and design wider margins into the RC circuit to sustain robust limits over the operating range.


